

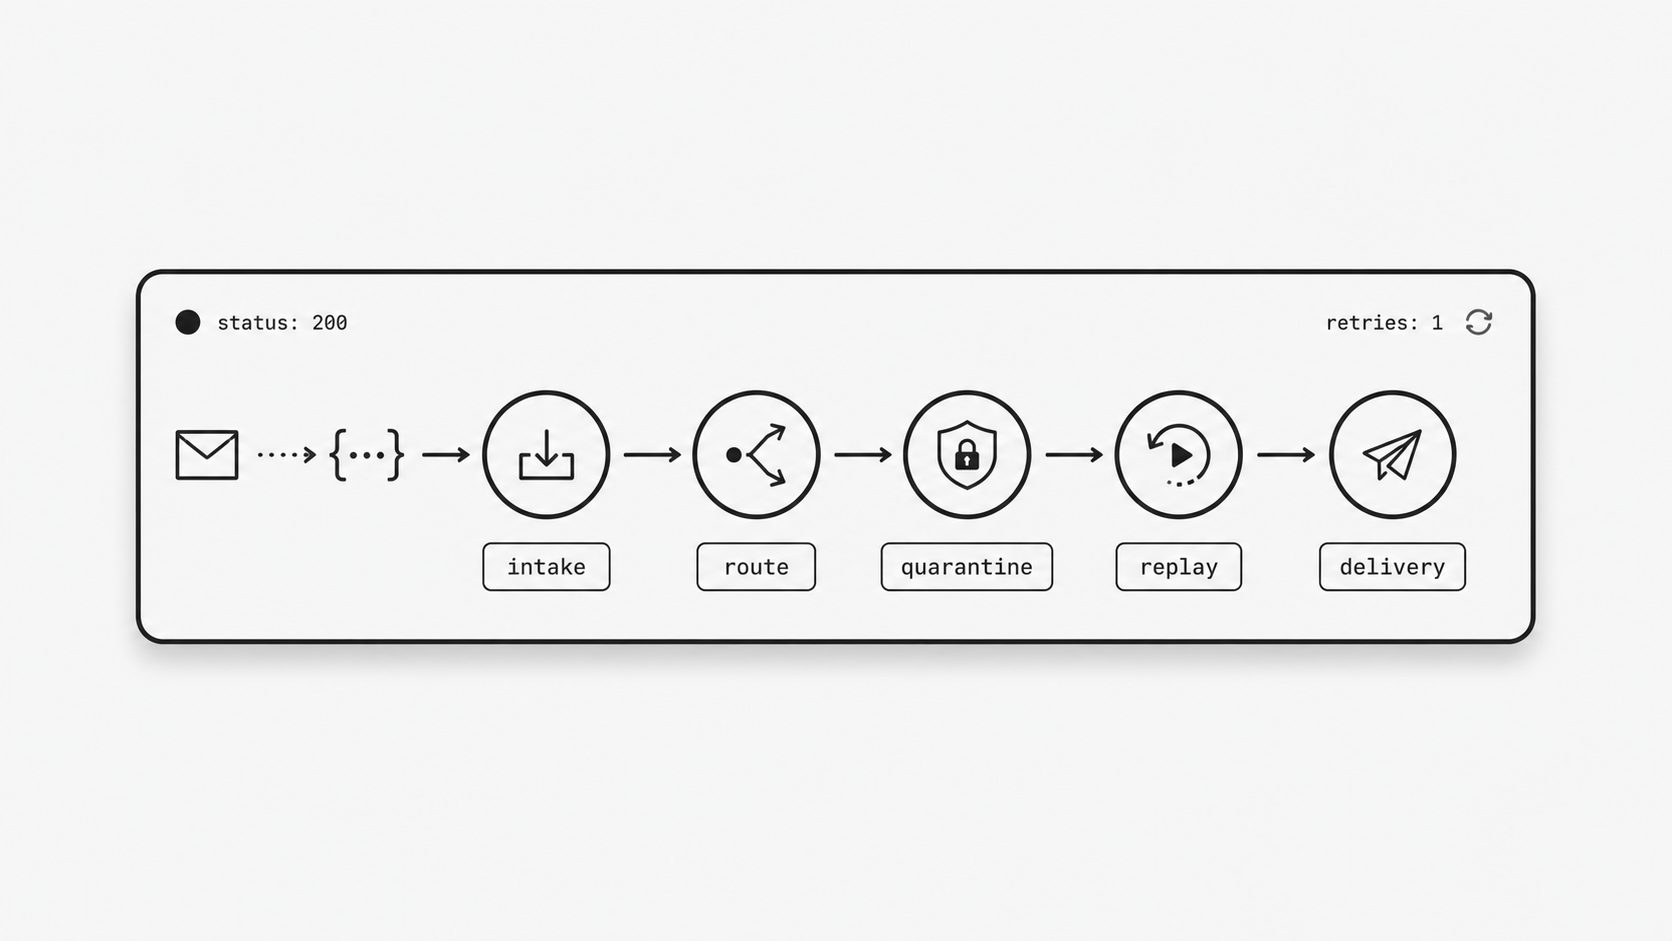
Operators experience observability as part of whether a platform is usable under pressure. As workflow volume grows, they need a fast way to see what happened in order and decide what to do next from the same operating view.
That is why I think event logs deserve to be treated as part of the product value itself. They complete the control loop inside an email ingestion layer. The quarantine workflow decides what should happen to a held message. Durable event logs preserve why that decision happened and what replay did next.
For ops and platform teams, an email-to-webhook workflow needs visibility into intake, routing, quarantine, replay, retries, and delivery outcomes. That history is part of the operating surface that makes the system understandable while work is still moving. When visibility is embedded in the platform, teams escalate less, recover faster, and trust the workflow more.
Why the event log becomes the real control panel
I have learned that the moment an integration gets busy, the UI stops being the thing operators trust first. They trust the record of what actually happened. When a customer asks why an email webhook did not fire, or why one payload was delayed while others moved through, the real control panel is the place that shows intake, decisions, retries, and outcomes in order. (Cloudflare Email Service - Observability)
That shift matters because ops teams are tired of building a separate observability project around every platform they adopt. If the product handles critical workflow traffic, visibility has to live inside the product experience itself. I do not mean a vanity dashboard with a few success counts. I mean a working surface where an operator can open one record and follow the path of a single message through the system with enough context to answer routine questions fast. (Cloudflare Log Explorer)
Key term: Event-log operating surface means the built-in product view where operators inspect message intake, routing decisions, delivery attempts, responses, retries, and outcomes in sequence.
You might be wondering: what makes an event log different from a support feature? For me, the answer is simple. A support feature helps after trust breaks. An operating surface helps preserve trust while the work is still moving. Native platform logs already reflect this product direction in the market. Cloudflare’s Email Service documentation groups logs, metrics, analytics, and audit visibility into the service itself, which signals that observability belongs alongside core email operations. Cloudflare’s Log Explorer goes even further by describing log investigation and monitoring directly in the platform dashboard and API, with an explicit goal of reducing the cost and complexity of shipping everything into third-party tools.
That is the practical bar I think modern platforms should meet. An operator should be able to answer a short list of high-frequency questions without opening a ticket or calling an engineer. Did the system receive the payload? Which rule touched it? Was it transformed? Was it quarantined? Did delivery fail, retry, or complete? Those answers live at message level, and they only become useful when they are presented as a clear sequence rather than scattered diagnostics.
MailWebhook turns this model into a concrete inspection and recovery path. In Events, an operator can open a message and use Delivery Attempts History to review delivery status, the captured request and response, latency, and network errors. After the receiver or route issue is fixed, Replay queues a fresh delivery attempt. The email webhook API exposes event, attempt, and replay operations for teams that need them in internal tools. The test-email and payload-inspection quickstart shows the UI inspection flow. This is where the platform’s context turns event history into practical operator control.
The insight here is straightforward: event visibility creates product value when it shortens the distance between a question and an answer. Once operators can inspect message-level history inside the platform, they move faster, escalate less often, and manage workflow risk with more confidence. I see that as a control advantage, not just an observability feature. In practice, the event log becomes the part of the product that proves the platform is understandable under pressure.
So what does a trustworthy message record need to show?
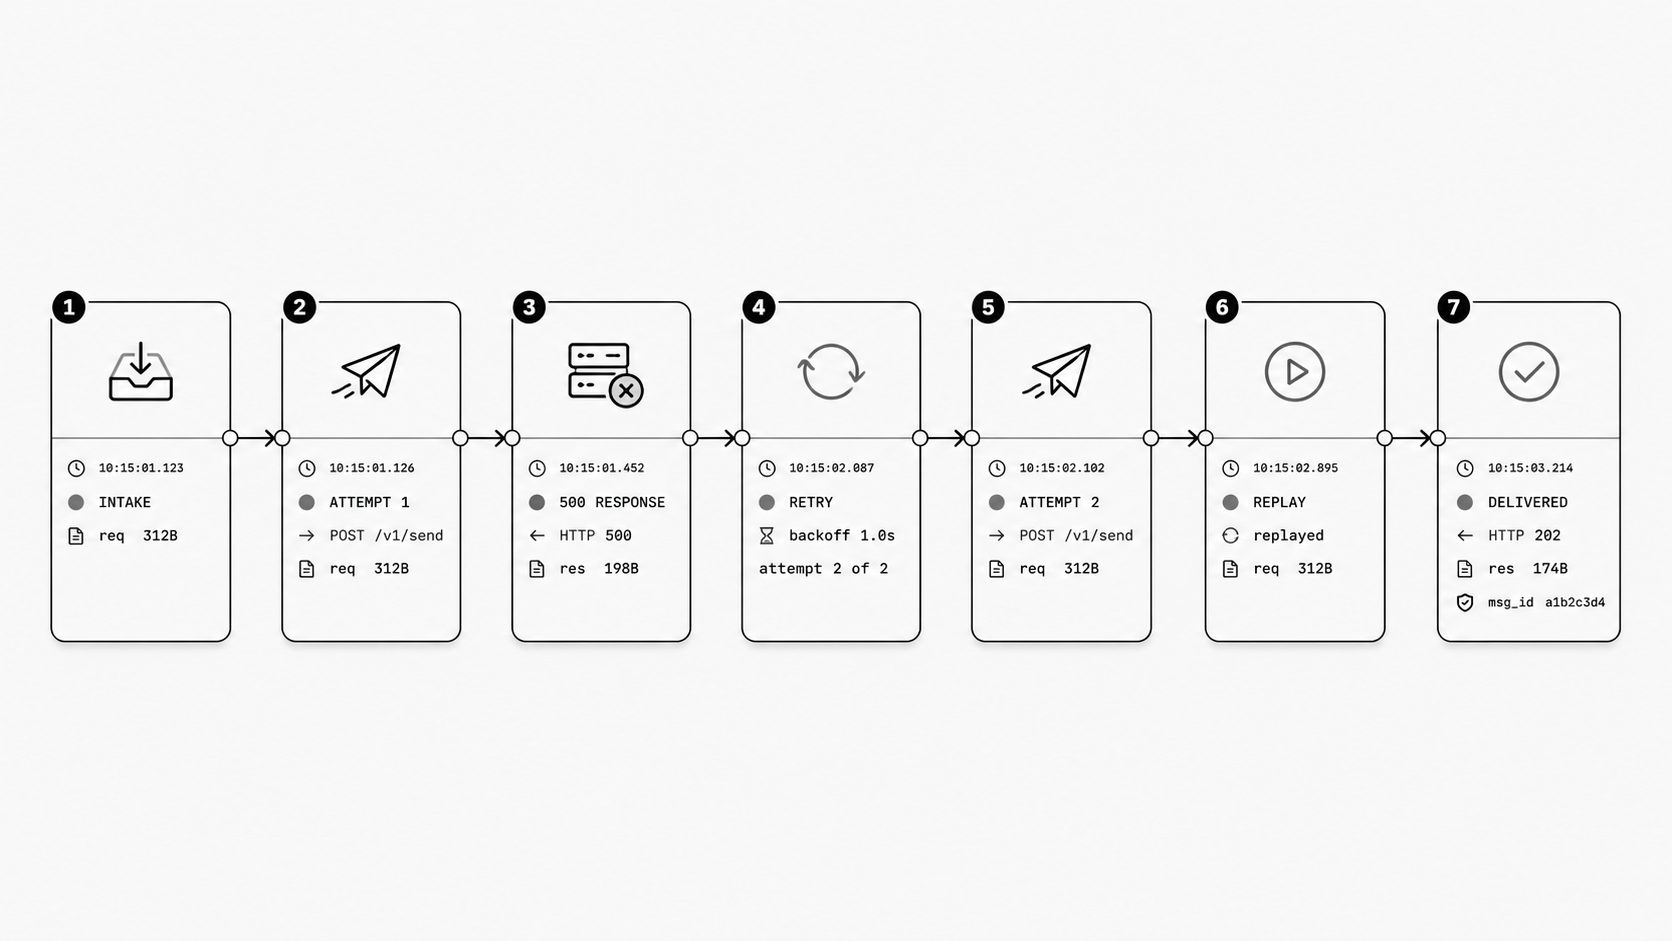
Many platforms lose trust at the exact moment an operator asks, “What happened, in order?” A trustworthy message record has to show more than that a payload appeared. It should show when it arrived, what delivery attempt was made, what response came back, and whether the message was retried or replayed later.
Key term: Audit-friendly message chronology means a time-ordered record of message intake, delivery attempts, responses, retries, and replays that operators can review and explain later.
When reviewing an integration surface, the most useful pattern is a message-by-message trail an operator can scan without engineering help. At a minimum, that includes timestamps, delivery status, the request that was sent, the response that came back, and a visible record of retries or manual resends. Stripe’s event-delivery view is a strong benchmark because it shows delivery status, HTTP status codes, and the timing of pending attempts. Stripe also documents automatic retries for up to three days in live mode and supports manual retries through its dashboard and CLI. These details show that retry and resend history are part of ordinary delivery management, and the chronology should preserve each attempt for audit confidence and day-to-day operations. (Stripe Docs - Webhooks)
MailWebhook applies that model directly. Its retries and replay documentation explains that Delivery Attempts History can include the request, response status, response preview, latency, and network error details. It also documents the UI path for reviewing that history, fixing the receiver or route issue, and queuing a fresh replay attempt.
The practical takeaway is simple: trust comes from sequence plus context. When one record shows intake, each delivery attempt, each response, and each replay in one place, operators can explain outcomes quickly and act with confidence. That is what makes an audit-friendly message chronology useful in real operations.
Operator self-service visibility: closing routine loops without engineering
I have seen a familiar pattern in busy platforms. The ticket queue grows even when the underlying issue is small. Someone asks why a webhook did not arrive. Someone else wants to know whether a rule changed the route. A customer success lead needs an answer before the next call. None of these questions are rare, and none of them should require an engineer every time. When operators can open a delivery record, see the status, review the attempt, and follow a documented recovery path, a large share of those escalations starts to disappear.
This is the part many teams underweight. They invest in routing logic, retry logic, and flexible integration features, then leave the day-to-day evidence of system behavior hidden behind support workflows. I think that creates drag for ops teams. GitHub offers a useful benchmark here because it records failures caused by endpoint downtime or slow responses and supports manual or automated redelivery through documented paths. That gives operators a practical model: identify the failed attempt, inspect the recorded reason, and choose the appropriate recovery action. (GitHub Docs - Handling Failed Webhook Deliveries)
MailWebhook’s failed webhook delivery guide turns that model into a bounded operator path: inspect the latest attempt, distinguish network failures from HTTP responses, fix the endpoint or route, and then wait for a retry or replay the event when appropriate.
That matters because operators rarely need full code-level debugging. They usually need practical answers to practical questions. Did the platform send the event? How did the destination respond? Was there a timeout? Is there a safe way to retry? A well-designed operating surface answers those questions in one place with enough context to act responsibly. You might be wondering: does this only matter for classic webhook products? I do not think so. The same expectation shows up anywhere teams manage routing and delivery decisions across integrations. If a platform exposes things like conditional email routing or an email routing rules API, operators still need a reviewable record of what rule executed, what target was chosen, and what happened next in delivery.
The deeper value is organizational. Self-service visibility changes who can resolve the first layer of operational uncertainty. Instead of turning every failed delivery into an engineering dependency, platform teams can equip operations staff with a bounded set of safe actions and a clear record to support them. That improves response speed, reduces interruptions for developers, and gives customer-facing teams better confidence when they answer “what happened” questions under pressure.
Key term: Operator self-service visibility means giving authorized operators enough message-level evidence and safe recovery controls to resolve routine delivery questions without engineering help.
My takeaway is simple: visibility becomes more valuable when it lets the right people close routine loops themselves. A platform earns trust when operators can inspect a failed delivery, understand the likely cause, and use a documented recovery step without waiting for an engineer to translate the logs. That is where escalations start to shrink. The product feels easier to run because the path from question to answer to action is already built into the operating experience.
Why visibility belongs inside the workflow platform
Operational evidence is most valuable at the moment someone has to make a decision. When signature state, delivery identity, endpoint responses, retry timing, and replay history live in different places, the operator must reconstruct the system before deciding what to do. Bringing those facts together turns the event log into a decision surface inside the workflow platform.
GitHub’s guidance connects webhook operation to secret validation, timely acknowledgments, redelivery, and a stable delivery identifier across attempts. (GitHub Docs - Best Practices for Using Webhooks) Mailgun’s documentation defines how receiver status codes affect delivery and when automatic retries occur. (Mailgun Docs - Webhook Retries) Together, these controls describe the evidence an operator needs: which event moved, how the receiver answered, and what recovery step comes next. An embedded view presents that evidence as one sequence and removes the need to assemble it from separate documentation and systems.
Imagine a webhook returns 500 after a route matched. With scattered evidence, an operator checks route settings, application logs, retry documentation, and support history to learn whether another attempt is pending. With embedded visibility, the same event can show the selected route, validation status, 500 response, next scheduled attempt, and replay history. The team can decide within minutes whether to wait, fix the endpoint, or replay while the full context is still visible.
Key term: Embedded observability value means the operational benefit a platform creates when logs, delivery evidence, and recovery controls are available inside the workflow product.
The practical payoff is a shorter path from evidence to action. The platform earns more value from controls it already has because operators can use them as one coherent recovery workflow.
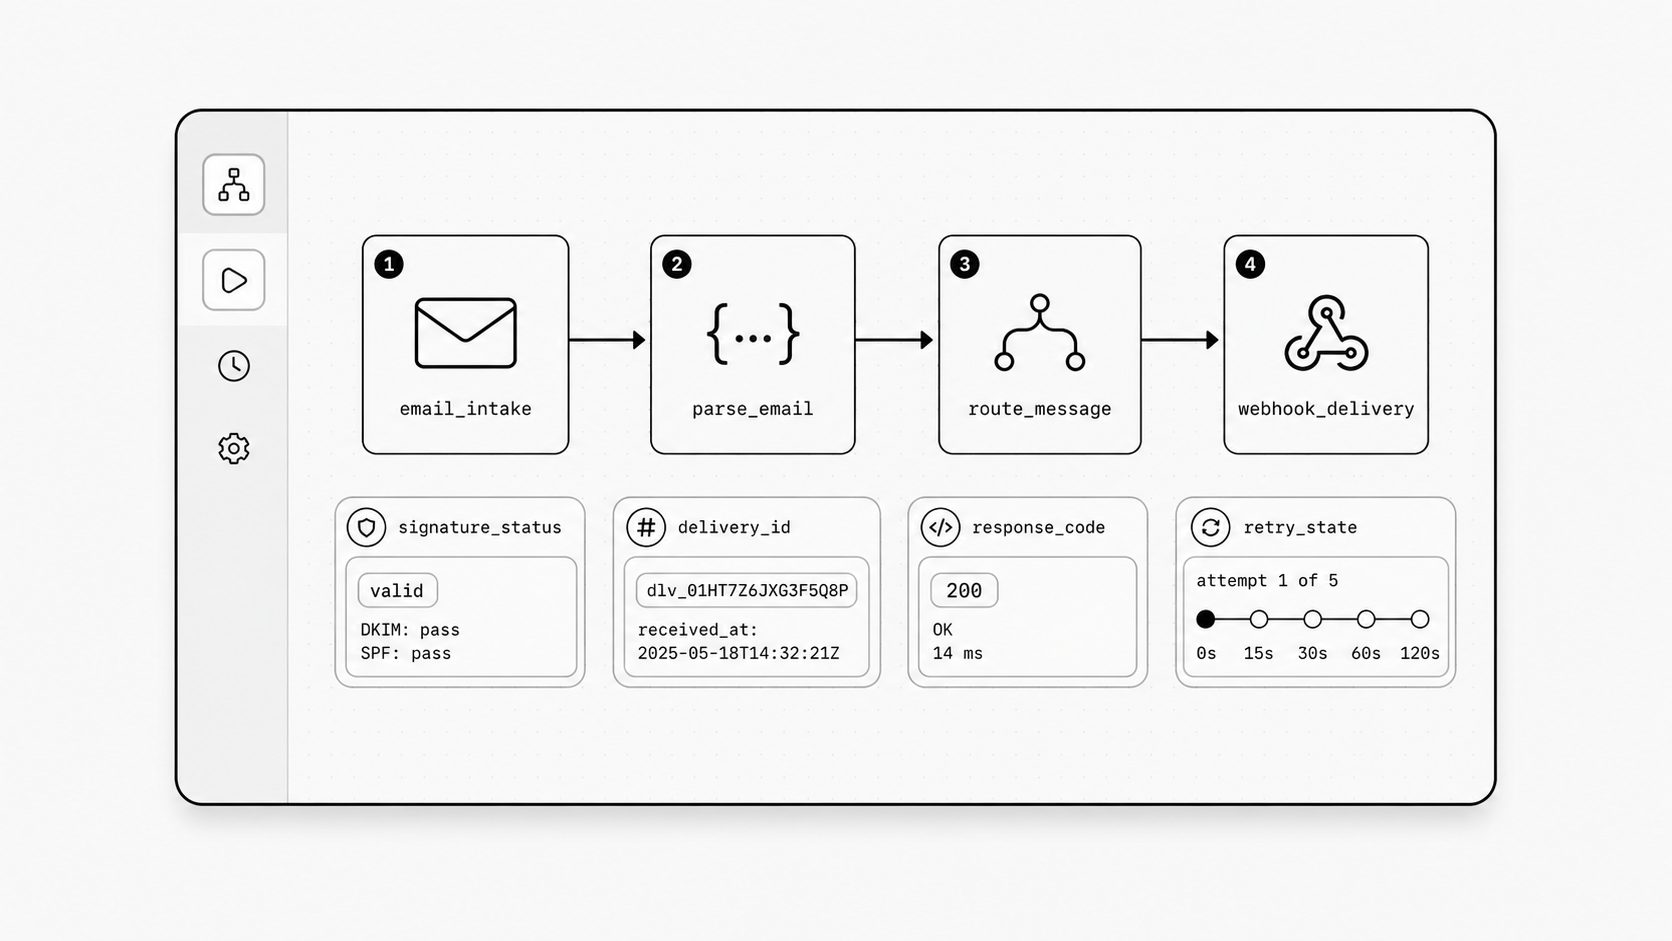
The common thread across modern workflow platforms is simple: the system becomes more valuable when its behavior is easier to inspect. A useful platform brings the story of a single message together, giving operators one place to review the record, understand the sequence, and take the next safe action.
That is why event visibility should be judged as a core product capability. When operators can answer routine delivery questions, review the full chronology of a message, and handle common recovery steps themselves, the platform delivers operational control through its logs. In my view, trust grows from reliable system behavior and a clear record of that behavior.